One of my Top 10 Supply Chain Improvement Resolutions for 2021 referred to SKU complexity and I recently discussed how that complexity negatively affects cost and service. With the discontinuity caused by COVID-19 many CEOs should be looking at leaner SKU portfolios but how do you approach this challenge?
Even in the absence of the pandemic your business may be struggling to cope with day to day forecasting and sales while managing innovation and range extensions. You can do much worse than give your price list a thorough review. Not just a cursory glance over a coffee and croissant but a detailed, scientific evaluation of what brings in the turnover and what eats into profit.
Few businesses are lucky enough to operate with just 1 or 2 powerhouse SKUs but an excessive list of items on the price list can severely affect your customer service and sales performance. In the service performance link above I looked at the cost to have a single SKU on the books and it is not insignificant when you take all elements of supply into account. This threshold value will vary from company to company and sector to sector but there will be a roughly estimated value for your situation.
If SKUs do not pay for themselves and contribute to the bottom line then why do they exist? SKUs plodding along with low margin AND low sales turnover cannot be worth the cost and effort of maintenance, can they? They are simply getting in the way of potentially more profitable SKUs and activities.
If you could base your business on high margin/high turnover SKUs then of course you would and at the drop of a hat. However, life is not that simple as the marketplace is becoming ever more competitive so you need to constantly review the wisdom of what you are putting in front of consumers. Decisions taken 24 months ago may well have been based on sound analysis but are those assumptions still valid? Is anything the same 24 months later? How many of your innovations actually reached business proposal financial delivery assumptions?
Unless your business is in dire straits already, a proportion of your SKUs will be either low margin/high turnover or vice versa. Both situations could provide reasonably healthy growth but wouldn’t it be better if you could edge them towards the high/high green quartile as per the image below? This a very simple approach but you should adjust to suit your particular priorities.
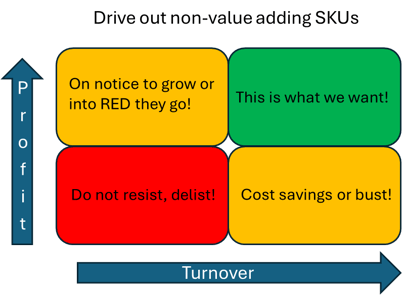 The first step is to make that very rough estimate of what your business spends on keeping an SKU on the price list. This is not an accurate science but you need to put a “stake in the ground” and agree a number, eg 30,000Eur for a 300M Eur business. If the margin of a particular SKU does not at least break-even then delisting must be considered. Staff who look after the market performance of those SKUs in the yellow segments need to be challenged on a quarterly basis to get more of their SKUs towards the green quartile, or delist.
If you carry out such an assessment and find that a majority of your SKUs are in the red segment then you might benefit from a professional, unbiased spring cleaning of your portfolio. Such an approach will remove any emotion and bias when clinically assessing what you should be placing on shelves. Once you have cleaned up your price list and established a routine process, you can easily manage this internally.
Inevitably, there will be push-backs from sales and marketing about local jewel SKUs or important range offerings. Some of these arguments may be valid but it is up to the CEO to decide if another SKU or no SKU would be more profitable for the company.
The market is hugely competitive so why would you continue shooting yourself in the foot with an unprofitable and out of focus SKU portfolio? Stop!